
What’s Behind the Declining College-Going Rate?
A Look at Indiana


For decades, the standard advice given to every high schooler was simple: “Go to college.” Whether it was a 2-year technical degree to master a trade or a 4-year bachelor’s degree to enter the professional world, higher education was viewed as the non-negotiable ticket to the middle class. As a result, the college-going rate, which had held steady at about 45-50% from 1959-1980, began a steady climb to a peak of 70% in 2016.
However, high school students have increasingly stopped believing this advice. Nationally, the college-going rate – the proportion of high school graduates who spend at least 1 semester enrolled in a certificate, 2-year, or 4-year program immediately after high school - has now declined from the peak of 70% to 62.8% in 2024. Compounded by the coming enrollment cliff, the challenges to college and university budgets are real.
While there is a lot of anecdotal evidence as to why fewer high school graduates are going to college (Inside Higher Ed, NBC, Higher Ed Dive, The Chronicle), more careful, quantitative studies are harder to come by.
This post will take a data-driven look at this question for the state of Indiana drawing explicitly on the work Marley Heritier did for her Master’s thesis. We (along with Dr. Christine Wilson) had the privilege of advising Marley. Her findings and implications will be helpful to anyone trying to understand this sobering trend in their state.
The Indiana Context
Indiana is currently facing what some have called an “economic emergency.” Despite Indiana high schools producing more graduates than they did a decade ago, the number of those students enrolling directly in some form of college has plummeted.
In 2008, Indiana’s college going rate was 66% and by 2024 it was 51.7% - a 14%+ drop and the most dramatic in the nation. To better understand what is going on, the study looked at trends in the college-going rate for each of Indiana’s 92 counties for the 2010-2023 period.1
Figure 1. Change in College-Going Rates by County in Indiana: 2010-2023
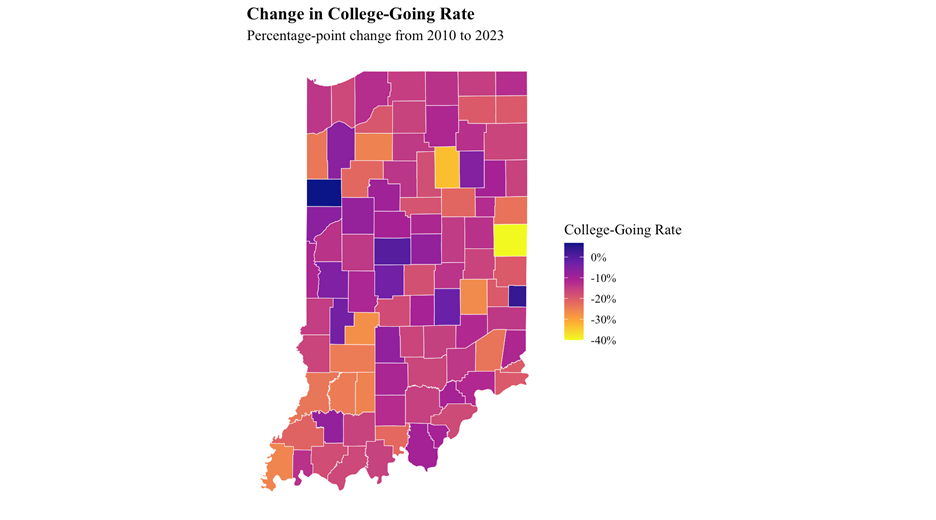
Source: Heritier, 2026.
While the college-going rate has declined in every county, the decline is especially acute in some counties (Figure 1). A central question is: why?
Looking at the changes over time and across counties, nearly half of the differences in the college-going rate (48 percent) are driven by persistent, structural differences *between* counties that change little over time. Another 35 percent is driven by statewide trends—factors that affect every Hoosier county simultaneously. Only 17 percent of the variation comes from specific changes happening *within* a county over time.
These findings provide some initial insight as to what is going on: the decline in the Indiana college-going rate is 1) embedded in structural differences across counties – i.e., counties with strong college-going rates tend to stay that way, and vice versa; and 2) there has been a systemic retreat across the state from traditional postsecondary pathways over time.
The Three Eras of Decline
The period studied was marked by three distinct periods during which college-going changed in fundamental ways.
Figure 2: Structural Breaks in Indiana’s State-wide College Going Rate
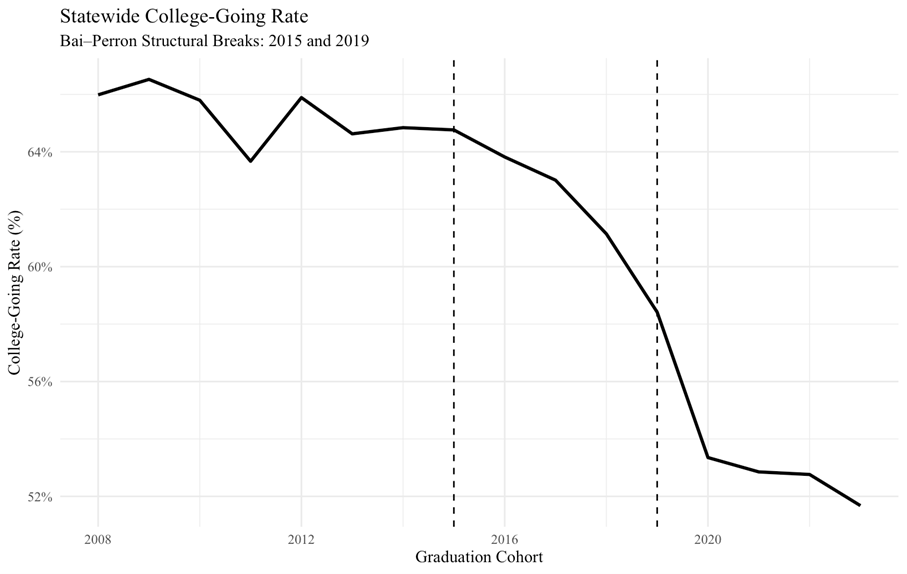
Source: Heritier, 2026.
2010–2015: In the early years of the study, the overall college-going rate only dropped by about 1 percentage point. However, there was some movement across pathways. Enrollment in two-year public associate degrees dropped by 2.4 percentage points, but this was largely offset by students choosing private colleges or leaving the state to attend college. In this period, the “college-going” spirit was alive and well; students were just changing their destination.
2015–2019: In the last half of the decade, the rate of decline accelerated and the college-going rate dropped by 6.4 percentage points. There was no buffer provided by private and out-of-state schools – in part because a number of private colleges went out of business during this period. We saw the first real signs of a net loss of college-going students that was not being made up elsewhere. The traditional 2-year sector, in particular, saw sustained losses.
2019–2023: Post-2019, the decline became a broad-based contraction, dropping another 6.7 percentage points over a 4-year period. This decline was accelerated by COVID-19, and contrary to what happened in many states, enrollment did not recover in Indiana after COVID. Declines were observed across both associate and bachelor’s pathways simultaneously – more students were simply choosing not to enroll in college at all.
The Collapse of the Associate Degree
One of the most striking results is that this decline did not affect every degree equally. The college-going decline in Indiana is, at its core, a collapse of enrollment in the 2-year sector. This is ironic given the strong state call for workforce development programs and given these institutions offer a low-cost, locally accessible option for students. The annual net cost of attendance at Ivy Tech Community College (our state’s 2-year system) is $7,000 and it ranges from $13,000 to $16,000 for Indiana’s 4-year schools.
When we look at the data for Indiana public institutions, the share of students pursuing an associate degree has fallen from roughly 16 percent to below 8 percent of the total college-going cohort. In contrast, while bachelor’s degree enrollment has also fallen, the drop was far less dramatic and occurred earlier in the decade. Relative to 4-year colleges, enrollment in the 2-year sector fell by about 30 percent.
Why is this happening? Heritier’s research suggests that the 2-year degree, which was once the “gateway” for working-class and rural students, is being squeezed by two forces: 1) strong local labor markets paying decent wages directly out of high school and 2) a shift in student preference toward short-term certificates. This second point needs to be kept in perspective: while certificate enrollments increased across all time periods in the study, they remain a small slice of the overall pie—not nearly enough to replace the thousands of students who have walked away from 2- and 4-year degree programs.
Geography is Important
In Indiana, where you grow up has an important impact on whether you pursue a college education. The study looked at the decline across rural, suburban, and metropolitan counties, and there were important differences.
Figure 3. Percentage-Point Change in College-Going Rate by Enrollment Pathway and County Type: 2010–2023
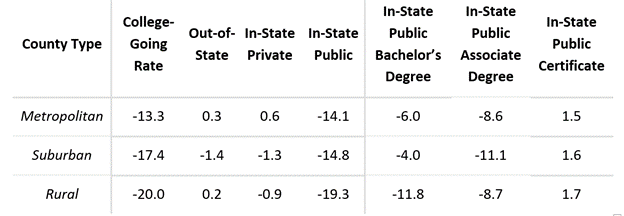
Source: Heritier, 2026. Note: All values represent percentage-point changes in enrollment rates between 2010 and 2023; pathway categories reflect percentage-point changes in the college-going rate for each enrollment pathway and sum up to the total percentage-point decline. In-state degree type pathways represent only students who enrolled in Indiana public institutions.
Rural counties in Indiana are facing a “perfect storm.” They started with similar college enrollment rates to metropolitan areas, but these rural counties have seen the most pronounced drops. In these rural communities, the decline is broad-based, impacting both bachelor’s (-11.8 percent) and associate (-8.7 percent) enrollment.
We attribute much of this to selective migration. The data shows that 94 percent of the variation in adult bachelor’s degree attainment is explained by fixed county characteristics. In other words, if you live in a rural county where fewer adults have degrees, you are less likely to see the value in getting a degree yourself. In addition, as the most educated young people tend to leave rural areas for jobs in more urban areas, there is less support for a “college-going culture”.
The Labor Market “Pull”
An obvious question is: if students aren’t going to college, what are they doing? The answer lies in the Indiana labor market.
Indiana’s economy is heavily weighted toward sectors that do not require a college degree. The study found a significant negative correlation between Blue Collar employment in a county and the college-going rate. In counties with high concentrations of manufacturing, trade, and logistics jobs, the “pull” of the workforce immediately after high school is strong.
When unemployment is low and entry-level wages in a factory or warehouse are elevated, the opportunity cost of sitting in a classroom for two to four years becomes too high for many students – especially where there isn’t much of a college-going culture anyway. Why take on debt—or even just skip two years of wages—when you can start at $20+ an hour tomorrow? This labor market pressure is a primary driver of the decline, especially in rural and suburban counties where these industries are the economic backbone.
Conversely, the study found a positive correlation between Professional & Science employment and college-going. In areas where the local economy revolves around knowledge-based work, the incentive to get a degree is constantly reinforced.
The Tuition Paradox
When people talk about the decline in college enrollment, the first thing they usually point to is the cost of tuition. “College is just too expensive,” is the common refrain. However, as we have written in the past, the data tell a different story.
Adjusted for inflation, tuition and fees (sticker price) declined during the later years of the study period (Figure 4). In addition, much of the decline in college-going behavior was concentrated in 2-year schools – where tuition is much lower. As such, the financial burden of college has not been the primary driver of the decline in the college-going rate.
Figure 4. Average Inflation-Adjusted In-State Tuition (Sticker Price) by Institution Type: 2000-2023
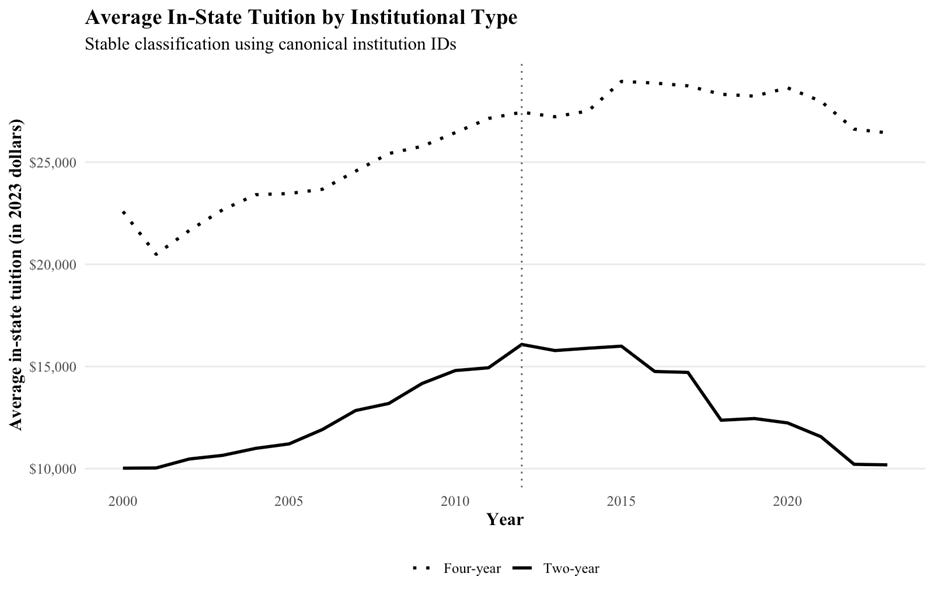
Source: Heritier, 2026.
There is a Tuition Paradox in play here. If the real cost of college isn’t the problem, then lowering tuition alone likely won’t be the solution to increasing the college-going rate.
The issue isn’t simply the price of the degree and it doesn’t look to be the actual earnings made possible by a degree. (Median annual earnings 4-years post-graduation for an Ivy Tech 2-year graduate who received federal aid are $53,000.)
Perceptions matter. The uncertain job/career outcome of the degree when compared to the known (typically overestimated) costs of college and the known earnings from jobs immediately available to new high school graduates shape perceptions of the value of college.
Preparation and Counseling Matters…a Lot
One of the strongest predictors of college-going behavior was academic preparation – the better prepared the students, the more likely they were to attend college. The study looked at a variety of factors related to academic preparation and the related issue of school quality including SAT scores, honors coursework, attendance rates, and school quality and all have strong positive associations with college-going rates.
Beyond preparation and school quality, it’s clear that the decision to attend or skip college isn’t made on graduation day—it’s often made years earlier. So counseling matters, and there is evidence that decisions made early in high school are strongly correlated with college attendance. Some examples:
The 21st Century Scholars Program: This program remains a true bright spot in Indiana’s higher education policy landscape. The 21st Century Scholars program offers up to a 100% tuition scholarship at 2- or 4-year public institutions (or partial coverage for private colleges) to income-eligible high school students. The study found that students in the program enroll in college at significantly higher rates than their peers—approximately 80 to 88 percent compared to just 52 percent of the general student body. However, participation is uneven across the state. In many rural counties, enrollment in the program is disproportionately low; this isn’t necessarily due to a lack of eligibility, but rather the result of significant informational gaps and outreach barriers.2
The Honors Diploma: The Honors Diploma is the single strongest positive predictor of college enrollment in the study. Students who earn an honors diploma are far more likely to enroll in 4-year bachelor’s programs, suggesting that the choice to pursue a rigorous academic path during high school is a critical bridge to higher education.
FAFSA Completion: Completing the FAFSA is a strong indicator that the student is seriously considering college. That said, the study found much within-county variation in FAFSA completion rates. Counties that prioritize and succeed at getting students to fill out financial aid forms have higher college enrollment rates as supporting FAFSA completion helps students see college as financially possible.
The Socioeconomic Anchor
Family income levels have an important role in explaining college-going behavior. Participation in the Free and Reduced-Price Lunch Program has the strongest negative correlation with college-going in the study. (While program eligibility rules are common to all counties, differences in income levels across counties drive differences in program participation.)
Figure 5. Change in Indiana Free or Reduced Lunch Program Participation: 2010-2023
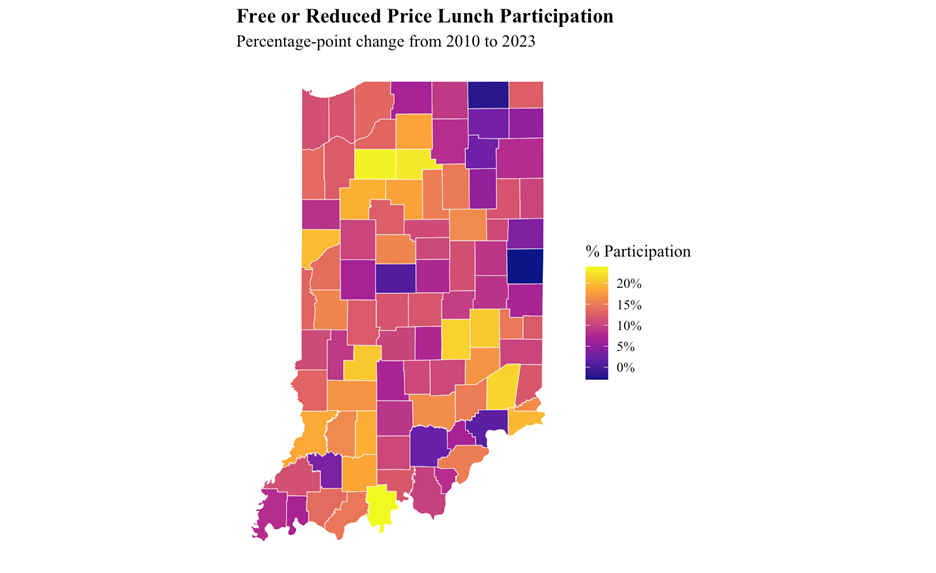
Source: Heritier, 2026.
Economic disadvantage acts as an anchor for high school graduates. In counties with high levels of poverty as measured by participation in the Free and Reduced-Price Lunch Program, the immediate need for income frequently overrides the long-term potential of a college degree.
This income effect wasn’t confined to the lowest income households. After controlling for time trends, the study found that counties gaining “High Income” households saw rising college rates, while those with more “Lower-Middle Income” households saw enrollment fall. This suggests that the decline is increasingly concentrated in the “middle” of the socioeconomic spectrum—the families who aren’t wealthy enough to pay for college easily, but aren’t poor enough to receive full financial aid.
The Supply Side: Institutional Access
Is the drop in college-going influenced by institutional access – were fewer schools available for students to attend, or were they located too far away from students?
A Distance-Weighted Access Index was constructed in the study to measure how many colleges and universities were located within a 50-mile radius of a county to track the geographic footprint of Indiana’s higher education system. The study found that:
Physical access to two-year public institutions has remained stable over the last decade.
The actual decline in access has been driven almost entirely by the closure of private for-profit providers.
Because access remained stable while enrollment fell, the study concludes the overall decline is not driven by a lack of nearby options.
There are differences in the role of access across county type. In suburban counties, proximity to a college is a strong, positive predictor of enrollment. In rural areas, however, the relationship is mixed. This suggests that for Indiana’s rural high school graduates, simply being near a college isn’t enough.
Moving Forward: What the Data Tells Us
This research paints a picture of a state at an economic crossroads. The “standard” pathway to a degree is under pressure from many angles: job-market pull, academic preparation and school quality issues, family income challenges, college-going attitudes…
If Indiana wants to reverse these trends, the state cannot simply focus on tuition. Better information on the returns to and the cost of a college-education is needed. Academic preparation and counseling must be front and center issues. The geographic divide that is leaving many rural students behind must be addressed. Programs such as the 21st Century Scholars and honors coursework matter and should get additional attention.
Addressing academic preparation, teacher and counselor training, information gaps, geographic inequalities, and affordability in an integrated way will likely matter far more than focusing on one “silver bullet” solution.
The two-year sector deserves special focus. If the community college pathway continues to erode, Indiana risks losing an effective tool for workforce preparation and social mobility. An associate degree isn’t just “another two years of school,” but can be a valuable, high-return investment that can compete with the immediate pull of the labor market – as well as help build the better-educated workforce needed to attract investment to the state.
A Final Question
During the period that college-going was declining, college completion and on-time completion rates in Indiana were rising rapidly. Comparing the 2010 entering cohort to the 2020 cohort, the 3-year completion rate of associate’s degrees nearly *tripled*, rising from 10.8 percent to 31.3 percent.
We don’t know exactly why completion rates rose so fast, but it raises the possibility that the two facts are connected. Perhaps the decline in college-going rates was driven by the sorts of students who, in previous years, would start but not finish college. By opting *not* to pursue a degree they weren’t going to finish anyway, they drove up the college completion rate. And, by immediately entering the workforce they enjoyed years of earnings and avoided accumulating student debt.
If that’s the case, a decline in college-going might actually be a *better* outcome for students, even if it deprived higher education institutions of tuition dollars. To be clear, we don’t know if that’s what happened, but it’s a provocative hypothesis that we’ll tackle in future work.
Next Week
We’ll wrap up the academic year by sharing some recent developments on topics we have covered this Spring. The Spring 2026 job market for college graduates, state policies impacting higher education, building trust in higher ed – just three of the topics we will update in our final post for the academic year. As always, thanks for reading Finding Equilibrium!
Our guest co-author this week, Marley Heritier, recently completed her Master’s thesis entitled “Why are Fewer Indiana High School Graduates Going to College? Evidence from County-Level Data”.
“Finding Equilibrium” is coauthored by Jay Akridge, Professor of Agricultural Economics, Trustee Chair in Teaching and Learning Excellence, and Provost Emeritus at Purdue University and David Hummels, Distinguished Professor of Economics and Dean Emeritus at the Daniels School of Business at Purdue.
This study is a county-level panel analysis of college-going patterns from 2010–2023, combining enrollment, demographic, economic, educational, and institutional data from sources including IPEDS, ACS, BLS, and NCES. The decomposition breaks the overall change in college-going rates into pathway-specific components by holding enrollment shares constant and isolating how much of the observed change is driven by shifts into/out of each postsecondary pathway across county types over time. Fixed-effects, stepwise pooled OLS, and pathway regression models were used to estimate how changes in preparation, labor market conditions, institutional characteristics, and local context relate to changes in college-going behavior across enrollment pathways over time.
It should be noted that important strides have recently been taken to close this gap. With the passage of House Enrolled Act (HEA) 1449-2023, the state now automatically enrolls eligible 7th and 8th graders who qualify for the Free and Reduced-Price Lunch Program in the 21st Century Scholars program. Previously, students had to manually “opt-in” by age 13-14—a procedural hurdle that often stood in the way of their future academic decisions. By removing this barrier, Indiana is eliminating an important constraint to program enrollment.
 | A guest post by
|
Hi Frank...thanks for the question...Marley did consider looking at accumulation of dual credits as another measure of academic preparation. The college-going rate focuses on high school graduates who attend at least one semester of college in the year after graduation. So, we would need to know whether or not a high school graduate had taken dual credit courses. Unfortunately, data was not collected on dual credit accumulation by high school graduates until 2012. So, Marley went with a longer data series instead of bringing the dual credit data in. Ironically, Indiana has one of the nation’s highest rates of participation in dual credit, and yet has experienced one of the nation’s steepest declines in college going. (https://www.nacep.org/resource-center/nacep-fast-facts/) Thanks again.
Do you know if the data include dual enrollment (i.e., high school students)? If so, I'm curious as to how that might change the results.