
Teaching Mandates Revisited
A Closer Look at Instructional Costs and Where Faculty Spend Their Time


We’ll interrupt your summer by revisiting a topic we wrote on last fall: state legislatures mandating teaching loads for public university faculty. We took a closer look at this issue recently in an essay for The Chronicle of Higher Education entitled The Faculty Workload Myth.
To quickly recap, multiple states in the spring passed legislation dictating how many classes that full-time faculty at state public universities must teach. Wisconsin is an example: there the legislature mandated that faculty at the University of Wisconsin’s two research-oriented campuses (Madison and Milwaukee) teach four three-credit courses each year and faculty at all other public universities in the state teach eight four-credit courses annually.
In the Chronicle essay, we recapped many of the arguments we made last fall about the misplaced focus of these mandates and the consequences of mandated teaching loads. But, we also dug more deeply into the questions 1) could colleges save significant sums of money if faculty teach more and 2) where do faculty actually spend their time? We’ll share some of that additional analysis in this post along with a few technical details that space constraints crowded out of the essay – and hope you will check out our full essay in the Chronicle!
Cost Savings from Increasing Teaching Loads?
State mandates on teaching loads follow from the notion that college costs too much, and that cutting faculty expenses would get these costs in line. As we’ve written previously, we think the first point ignores the fact that the real cost of attending college has fallen for a decade. What about the second? Are faculty costs a large and rising share of the total?
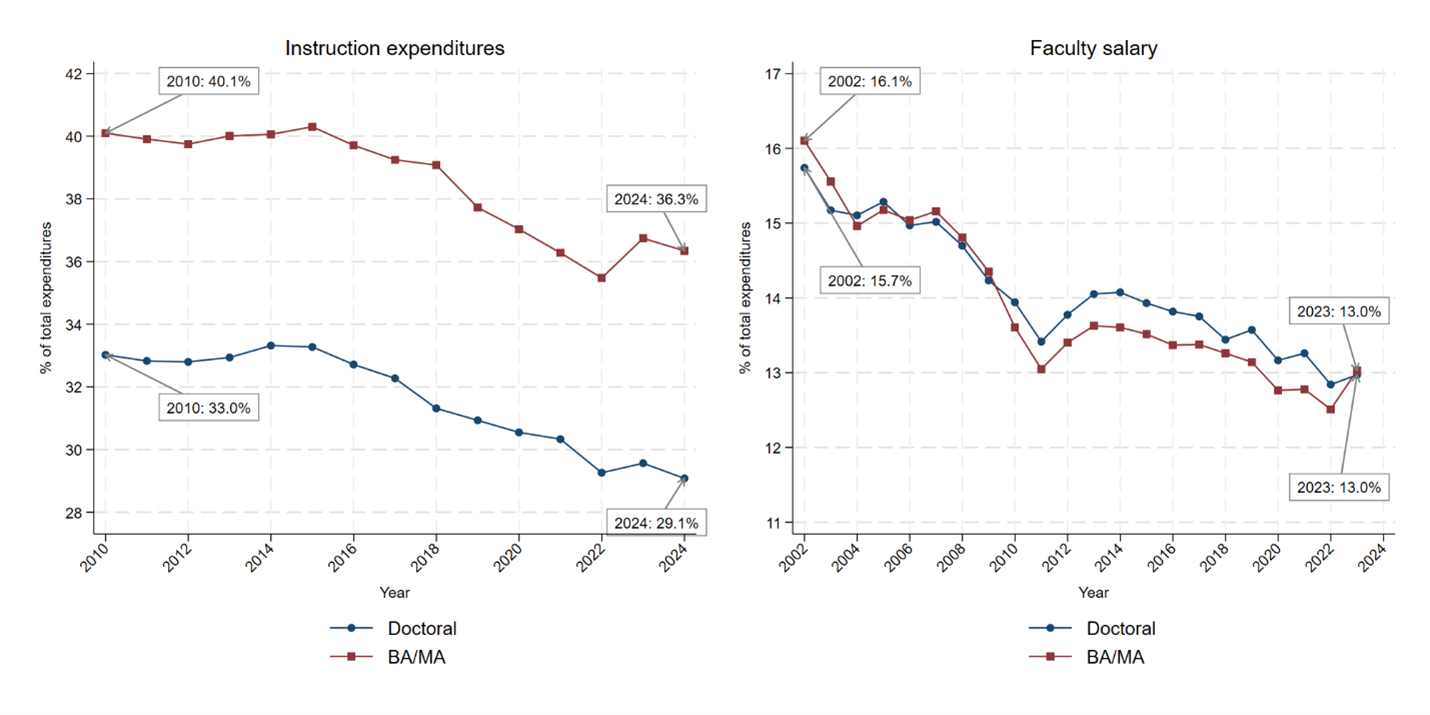
Using data from the National Center for Education Statistics, we looked at total instruction expenditures and faculty salary as a percentage of total university expenditures for median public Doctoral and BA/MA institutions.
Both instructional expenditures and faculty costs have been falling for more than a decade as public universities spend more money on other things. For example, university budget shares have been rising for student aid, student services, and academic support (19.5 percent in the most recent year of data); institutional support, i.e. administration (9 percent); auxiliary services such as athletics, residence halls, and dining (8 percent); and running hospitals (16 percent).
Source: Author’s analysis, National Center for Education Statistics.
Another reason spending on faculty has been declining: universities have been moving to adjunct and part-time faculty and away from (more expensive) tenured faculty for decades. The AAUP reports that contingent faculty now make up about two-thirds of the total faculty headcount.
Beyond changes in the composition of faculty, faculty salaries in real terms have declined dramatically over the past decade. Again putting data from the National Center for Education Statistics to work, we used regression analysis to evaluate the change in faculty salaries, holding fixed rank and institution. Tenured and tenure-track salaries are down 10 percent in real terms since 2016 and are lower today than they were in 2002; nontenured faculty salaries are down 4 percent since 2016 and are at 2002 levels today.1
So, faculty salaries represent a modest and declining share of the total cost of running a university, in part because spending in other areas has increased and in part because tenured faculty have been replaced by less expensive part-timers and adjuncts and faculty salaries have not kept pace with inflation.
Faculty salaries are now just 13 percent of total expenditures.2 Instructional and research expenditures *combined* are only 37 percent of the total spend in BA/MA institutions and 42 percent for Doctoral institutions.
Faculty reading this are likely to pause and ask: wait, what again is the point of a university if not to engage in research and teaching? As former administrators we know that direct support of teaching and research requires indirect support by other functions. Among other things, you can’t teach students unless you first recruit and admit them; you can’t do research unless you comply with a host of regulations and policies, etc. But these other functions can be done with greater or lesser efficiency and we aren’t seeing a lot of legislative mandates to reduce the expenses that represent the lion’s share of the university budget. In fact, a lot of legislative mandates increase expenditures by heightening the costs of regulatory compliance.
We’re not sure if legislators don’t realize this math, or if faculty are just the most obvious target of budget cutting for reasons discussed below. But if the goal is really to legislatively manage the cost of a college education, it’s not clear you can make much progress by squeezing the amount universities spend on faculty.
Where Do Faculty Spend Their Time?
Why all the focus on faculty teaching loads? One big reason: the public (and legislators) don’t understand what faculty actually do. This is not surprising. Even those who attended college see faculty work through the lens of time spent with students in the classroom.
But, classroom teaching is simply the tip of the iceberg and all the work it takes to teach a course well and the rest of the work faculty do (research, engagement, service) is hidden below the waterline to most. Many of us have heard the follow-up question ‘what else do you do’ after being asked ‘how many courses do you teach’…
Let’s bring in some data here: where do faculty spend their time? For the Chronicle essay, we looked at data graciously provided by Allison BrckaLorenz, Director of the Faculty Survey of Student Engagement (FSSE) at Indiana University’s Center for Postsecondary Research. The Center surveys thousands of faculty members annually at universities across the nation to better understand questions such as this.
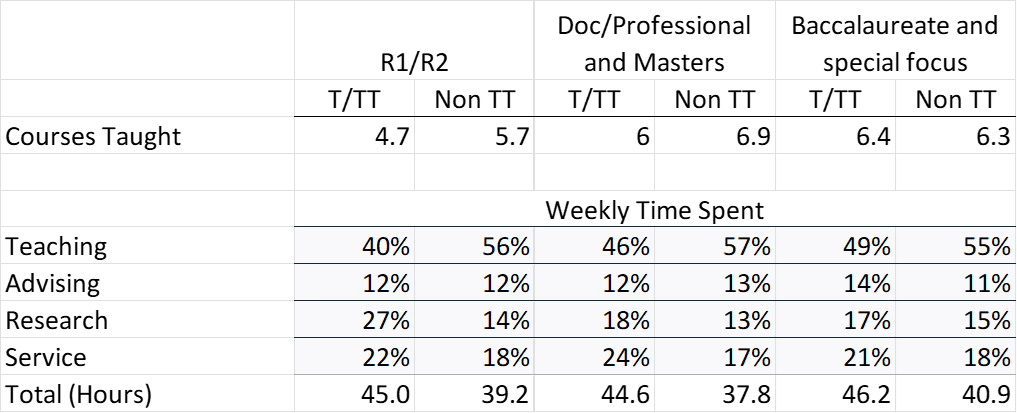
The table below reports FSSE data on courses taught, time allocation, and hours worked for R1/R2, Doctoral/Professional and Masters, and Baccalaureate and Special Focus universities.
Source: Faculty Survey of Student Engagement , IU Center for Postsecondary Research.
Not surprisingly, faculty at R1/R2 universities teach fewer courses annually than those at other types of universities. Somewhat ironically though, meeting the teaching mandates that have been implemented would require 1-2 more courses per year for pretty much all faculty *except* tenure/tenure track faculty at R1/R2 universities.
As an aside, FSEE has surveys going back a number of years. The average course load and time allocations are remarkably consistent over the last decade. The main thing that *has* changed is the size of the “typical” course taught by tenure and tenure-track faculty. It has gotten smaller as non-TT faculty step into larger courses.
What’s the big deal - why is asking a faculty member to teach another course or two a problem? Let’s take a faculty member teaching five three-credit-hour courses a year. If we count only the contact hours in the classroom, 16 weeks in a semester multiplied by 2.5 hours of in-class time represents 40 contact hours per three-credit-hour class. Multiply that by five classes a year to get 200 contact hours … why, that’s only about five weeks of work spread over a nine-month contract. Adding another course or two shouldn’t be an issue – heck make it three or four!
The problem is that anyone who has ever taught a college course knows that most of the work is not in the classroom, it is the work done before and after class. Turning again to the FSSE data, faculty report that their teaching time is split into class meetings (23 percent), prep (21 percent), grading (19 percent), student meetings (12 percent), course administration (15 percent), and course improvement (10 percent). While the total time invested in teaching differs across institutions and faculty types, the distribution of time across activities is remarkably similar.
Teaching well takes a lot of time and supporting the broader education and placement of students takes time beyond that invested in teaching directly.
Implications
All of the activities related to teaching and advising soak up 62% - 70% of the faculty week – which leaves 30-38% of the week for research and service (including engagement work).
The implications of increasing faculty course loads are obvious: something has to give. Either faculty will spend less time on the courses they already teach. Or, they will reduce the time they spend on research, taking the university to the public through their engagement activities, or on the service they provide that keeps the university operating.
We think that any cost saving benefits of teaching mandates will be overwhelmed by the unintended consequences of these policies: diminished teaching quality and a reduction in the value a public university provides society through research and engagement.
There is a better way. As we ended the Chronicle essay: “Increased pressures from budget allocations, more transparency, and market competition for students will push universities to rebalance teaching portfolios and lead to innovative changes in teaching and learning. Government micromanagement via teaching mandates will not.”
“Finding Equilibrium” is coauthored by Jay Akridge, Professor of Agricultural Economics, Trustee Chair in Teaching and Learning Excellence, and Provost Emeritus at Purdue University and David Hummels, Distinguished Professor of Economics and Dean Emeritus at the Daniels School of Business at Purdue.
We take NCES IPEDS data on the average salary paid for each faculty rank at each institution and regress it on institution x rank fixed effects and a set of dummy variables for each year. The fixed effects absorb differences in the average salary for each institution and rank, e.g. Purdue full professors. The year dummies represent the change in salary *within* each institution rank, averaged over all institutions. This does not account for the field composition of the faculty and so likely understates the decline because expensive faculty (in business and engineering) are growing relative to less expensive faculty (in the humanities).
We haven’t charted total faculty compensation, including benefits, because benefits data are not available for the entire sample period; if you include benefits for more recent years, it brings the total faculty compensation to more like 15-16% of total spend.
These essays are incredible. I used to joke that my job was to explain the university to the world and, sometimes, the world to the university. This description of teaching trade-offs is constructively instructive for all involved-students, parents, professors, politicians and the public.
This should be required reading for every state legislator!