


While university faculty and staff think about their primary mission in terms of discovery and learning, much of the public notice paid to universities focuses on … football. And for a few weeks in March, basketball.
The attention paid to intercollegiate athletics, and the dollars associated with it, have grown sharply in recent years. TV contracts have exploded in value, and are now worth over three billion dollars a year. Private equity firms are trying to muscle into ownership of major conferences. The athletes themselves command NIL payments to rival elite professionals.
But all this attention and all this money creates outcomes many regard as problematic. The transfer portal has turned athlete’s commitment to programs into a turnstile: over 10,900 football players, and almost a quarter of all Division 1 players, were in the portal in early January 2026. Universities are fighting back, suing departing athletes for breach of contract. Coaches are fired despite holding long-term guarantees that obligate their former employers to pay out millions: the most expensive 15 coaches fired in Fall 2025 are collectively owed almost a quarter of a billion dollars!
Sports gambling is rampant on college campuses, with nearly 60 percent of students engaged in betting, a third of athletes reporting harassment by disgruntled bettors, and the FBI investigating point shaving scandals. Even governors have gotten into the act, treating the leadership of athletic departments as a matter of critical state business.
Is any of this good for universities, their students or their faculty? Or is it time to follow the lead of University of Chicago’s (in)famous president Robert Hutchins who declared that “football is an infernal nuisance”, and also, “Football, fraternities, and fun have no place in the university. They were introduced only to entertain those who shouldn’t be in the University”.
Chicago was a founding member of the Big10 and frequent winner of conference football titles as well as the 1905 national championship. But Hutchins closed Chicago’s football program in 1939, only a few years after the Maroon’s Jay Berwanger won the first Heisman trophy. He then repurposed the football field to shelter Chicago Pile-1, the world’s first self-sustaining nuclear reactor as part of the Manhattan Project.
For university leaders today, challenging the primacy of college athletics is no less radioactive. Students, alumni, university leaders, governing boards, and yes, governors appear deeply invested in win-loss records and playoff appearances.
And to be clear, you’ll find us at Mackey Arena losing our voices and our hearing at every home game on the Boilermakers schedule. (Jay has about four decades invested… and much better seats…)
But at some point, universities may want to ask the question: what are we doing here?
In the next three posts, we will try to address a few critical questions about athletics.
1. How important are athletics in terms of university finances and where is the money flowing?
2. What are the measurable ancillary benefits to the university of running an intercollegiate athletics program?
3. How are NIL, revenue sharing, and transfer portal operations changing the nature of college athletics and what decisions do universities face in this new environment?
And then we’ll conclude with some thoughts on whether Hutchins had it right, or whether we should all just relax, and welcome our private equity and broadcast overlords.

Athletics Participation and Budgets
While Division I power conferences in football and men’s basketball dominate media coverage, these athletes are only about a third of the student-athletes who competed in intercollegiate athletics across three NCAA and one NAIA division. Using numbers from 2024-2025:
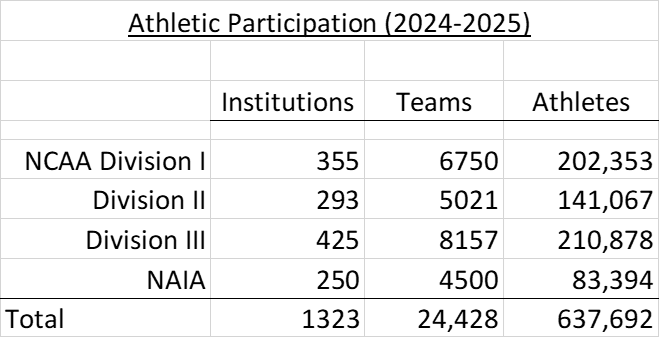
Source: https://www.ncaa.org/sports/2018/10/10/ncaa-sports-sponsorship-and-participation-rates-database.aspx
These divisions differ in the size of the institution, the national v. regional scope of competition, and their treatment of athletic scholarships. NCAA Division I institutions historically had scholarship limits but have recently shifted to unlimited scholarships subject to roster limits (more in our third post). NAIA and NCAA Division II institutions have hard per-sport scholarship caps but typically divide these up with partial scholarships offered to many athletes. Division III institutions are prohibited from offering athletic scholarships, though the large majority of these athletes receive direct financial assistance from their universities.
These divisions also differ markedly in the importance of student-athletes in overall enrollment.
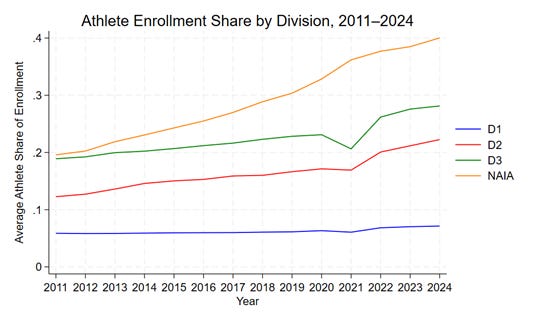
Source: Authors calculations based on IPEDS and https://www.ncaa.org/sports/2018/10/10/ncaa-sports-sponsorship-and-participation-rates-database.aspx
Division I schools have more athletes overall, but due to the larger overall size of these universities, athletes represent a much smaller portion of overall enrollments. The remaining divisions are far more reliant on student-athletes for enrollment – they now comprise 28% and 40% of enrollment in DIII and NAIA schools respectively – with dramatic increases in these shares over the past 15 years.
These divisions also differ significantly in their overall expenditures on athletics. Using data extracted from the Equity in Athletics Data Analysis project (EADA) for 2024, we calculated total athletic department expenditures and expenditures per athlete and report the averages (and medians) within each division.
These numbers do not include the value of Name-Image-Likeness (NIL) deals that flow directly from private sources to athletes. Ohio State’s NIL collectives are reported to have spent $35 million this past year to enable a repeat as national football champions (oops).
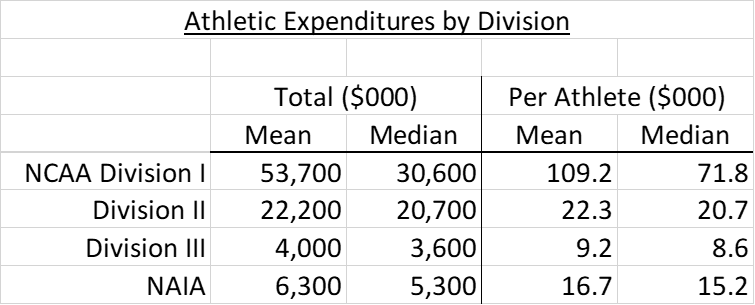
Source: Authors calculations based on EADA
Division I expenditures are significantly higher than the others, and within divisions, the largest institutions have much higher expenditures (which is why the averages are higher than the medians).
For greater detail on Division I expenditures and revenues, we next turn to data from two sources: the Knight-Newhouse College Athletics Database, a joint project of the Knight Commission on Intercollegiate Athletics and the Syracuse Newhouse School of Public Communications; and USA Today Sports Financial Database. In both cases, data are drawn from public universities, which when requested under public records acts, must reveal details of athletics expenditures and revenues.
The primary difference in total expenditures depends on whether these institutions have football teams, and within that set, whether the football teams are FBS (Football Bowl Subdivision, or top tier, 136 total), FCS (Football Championship Subdivision, second tier, 129 total), or NFS (No Football Subdivision, 100). In 2024, the median FBS athletics program expended $101 million; the median FCS program expended $21.7 million; and the median NFS program expended $18.7 million.
Even within the top tier of FBS there are huge differences. In 2024, Ohio State’s top-spending athletic department had expenditures of $295 million, about 13 times more than Louisiana-Monroe. Given differences in the sources of funds supporting large and small athletic programs, these differences in resources will almost certainly grow.
Where Does the Money Go?
We will stick with Division I schools, broken into totals that separate FBS, FCS, and NFS. Interested readers can go to Knight-Newhouse to see more detail by conference or by individual institution.
We report total dollars spent in 2024 for all FBS and FCS institutions, the percentage of various sub-categories in the total, and the real (inflation-adjusted) percentage growth in each since 2005. We highlight categories that are growing much faster (brown) or slower (yellow) than average expenditures.
Athletics expenditures have doubled in FCS (98.9% growth) and more than doubled in FBS (120%) over twenty years.
Within that, many FBS spending categories grew even faster in inflation-adjusted terms: facilities and debt service (164%); recruiting (157%); coaching salaries (156%) - especially football coaches and severance; game expenses and travel (129%); compensation for non-coaching staff (125%).
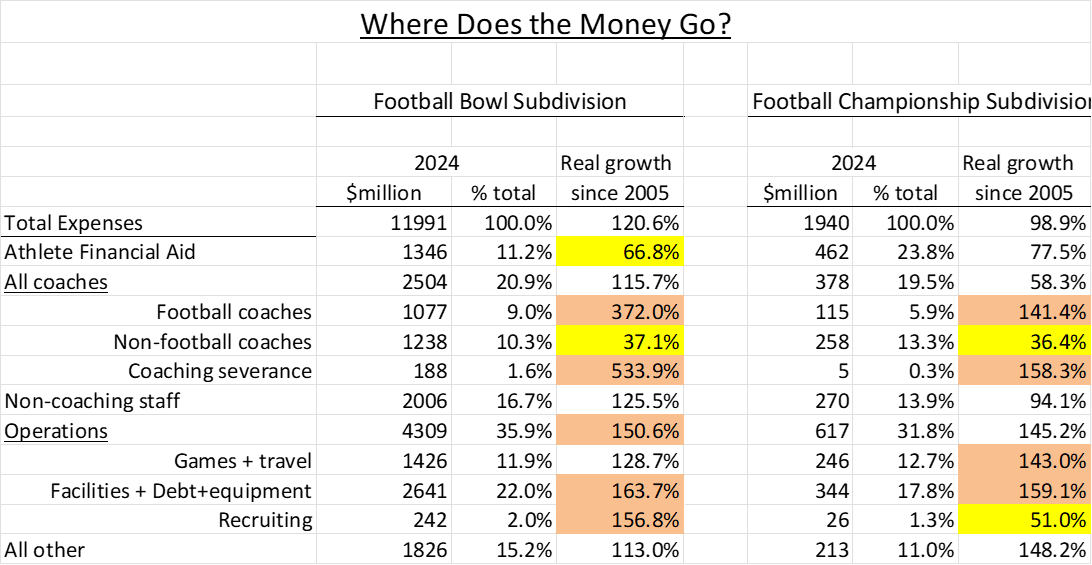
Source: Knight-Newhouse College Athletics Database, author calculations
There are some low-end outliers. Financial aid to student-athletes grew much more slowly than overall expenditures and now represents just 11% of overall FBS budgets. And salaries paid to coaches outside of football grew faster than inflation but not by much. (Notably, the number of head coaches has not much changed since 2005, but the number of assistant coaches has skyrocketed… growing 62%).
More on Coaches
On the high end, football coaches salaries for FBS schools rose 372% while coaching severance payouts grew 534%, from about $29.7M in 2005 to $188.1M in 2024. And as we noted in the introduction, just 15 coaches fired in the fall of 2025 will earn close to a quarter billion dollars ($228 million to be precise) in payouts over the next few years. So the severance number will grow sharply in the next iterations of the data.
To put these numbers in context, the average net price of attendance at a public four-year university in the US is about $16,000, and the average salary of an assistant professor is $85,000. The severance packages for those 15 coaches would pay for about 14,250 students to attend a year of college at no cost. Or pay for about 2700 new professors for a year.
USA Today also provides salary details for specific coaches going back to 2006. In that year, the five highest paid football coaches earned an average of $4.34 million (inflation adjusted). In 2024, the top five earned on average of $11 million. Ascending from an assistant coach to the top job typically results in a windfall, annual payments that are often 3 or more times higher than the previous job and guaranteed against failure for multiple years. (Men’s head basketball coaches have seen a similar percentage rise in salary but we don’t have data on assistant coaches.)
Some football coaches have enjoyed astronomical increases as they are promoted and jump between jobs. Consider Alabama’s Kalen Deboer. In 2016, he was earning a solid $193k (in 2024 dollars) as an assistant for Eastern Michigan, enough to hire two assistant professors at an average public university in that year. He doubled that with a move to Fresno State, doubled it again moving to Indiana, increased it 62% moving back to Fresno State as head coach, then 130% again moving to Washington. An appearance (a loss to the mighty Wolverines!) in the national title game enabled him to triple his salary by moving to Alabama. That’s a 50-fold increase in salary in 9 years. Alabama has lost 8 games in his two years, their worst record in two decades.
One can find many dizzying ascents like this. Missouri’s head coach, Eliah Drinkwitz, who wins 61% of his games and usually finishes in the middle of the SEC, is paid $9 million a year. That is 128 times what he made just 12 years ago.
Why? Athletic directors are all looking for the next Nick Saban. Indiana’s AD found him in Curt Cignetti. Cignetti is making at least 19 times what he earned at James Madison 3 years ago but just delivered a national title to the historically worst team in all of college football. “At least” because the playoff repeat triggered an automatic renegotiation of the contract signed two months earlier.
The trouble is: college football programs very rarely win the Nick Saban or Curt Cignetti lottery.
Where Does the Money Come From?
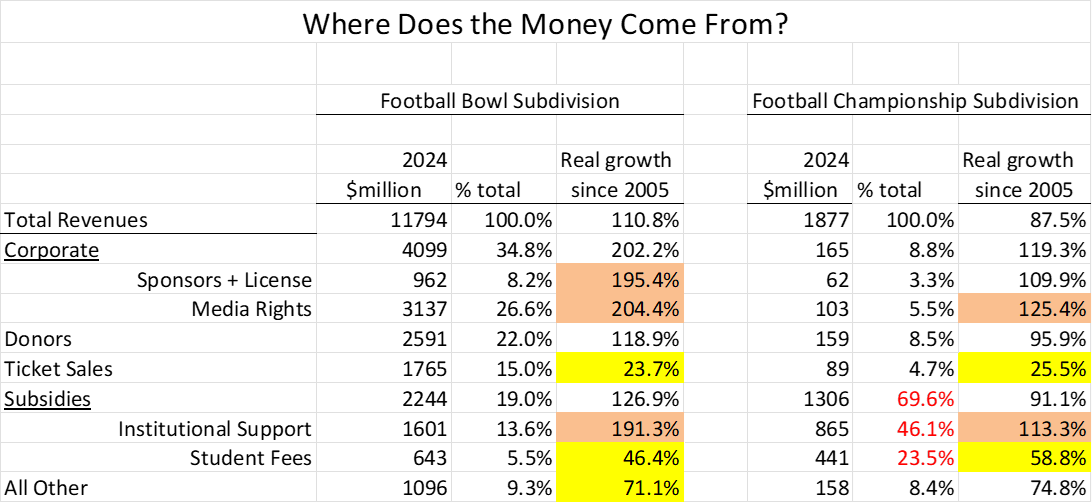
Again using Knight-Newhouse, we show total revenues (dollars, % of total) and real (inflation adjusted) growth in revenues since 2005 for FBS and FCS.
Total athletic department revenues have risen almost as fast as expenditures (110.8% in inflation adjusted terms since 2005 for FBS; 87.5% for FCS). In FBS, this is driven by outside money: a tripling of corporate sponsorships and media rights, which now comprise over a third of revenues and more than a doubling of donor contributions. But not, it seems, by ticket sales, which grew anemically and represent just 15% of revenues. (Though, this inference is a little tricky. It may be that a significant portion of donor gifts – 22% of total revenue – actually represent an effort to advance in the ticket queue or upgrade seats, as opposed to a pure charitable impulse.)
Source: Knight-Newhouse College Athletics Database, author calculations
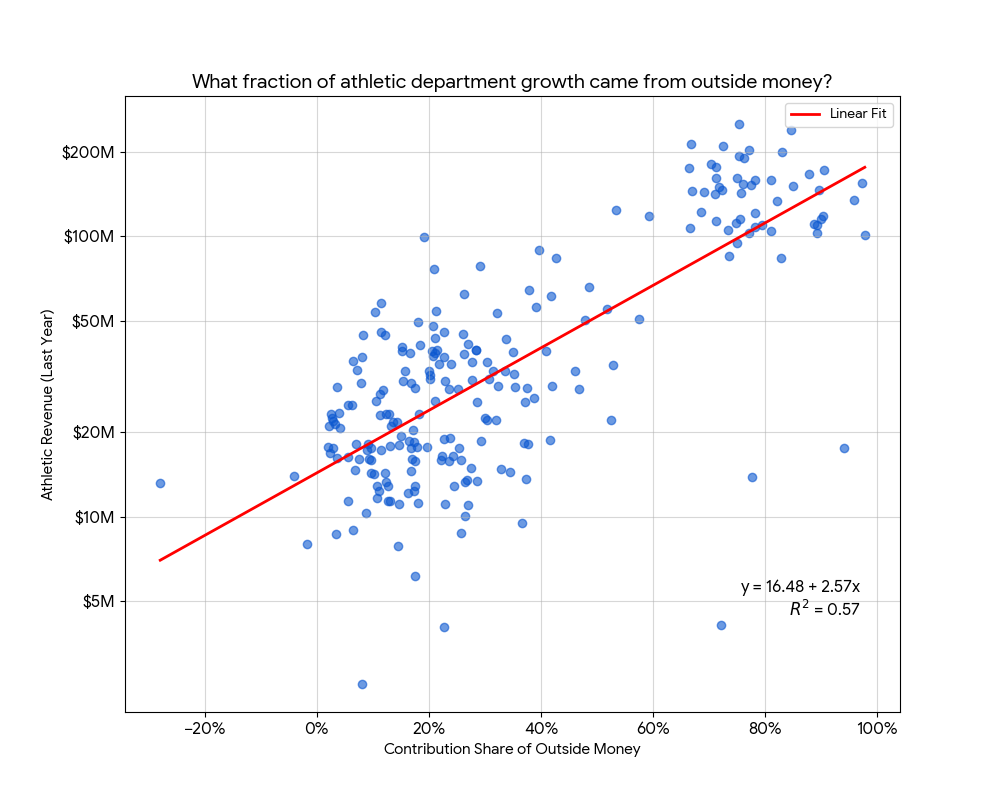
To see the impact of outside money, we calculated the contribution of outside money to overall growth in revenues for each institution. If outside money rose by $8 million and overall revenues grew by $10 million, then outside money accounted for 80% of overall growth. Using USA Today data, we calculated this contribution share and plotted it against the overall size of the institution.
Source: Authors calculations using Gemini code, based on USA Today data.
There is a strong relationship between size and outside money. In the largest institutions, those spending $100 million or more, between 70 and 95 percent of the growth in overall revenues came from outside money: corporate licensing, media rights, and donors.
Subsidies Keep Athletics Budgets Afloat…and Growing Fast
It’s important to note that these aggregate revenue numbers are something of an accounting fiction. The NCAA requires that schools report athletic department budgets to be in surplus or at least balanced *after* accounting for any institutional subsidies. Put another way, if athletic revenues from other sources come up $20 million short of expenditures, the university must report that they subsidized the athletic department to the tune of $20 million.
For FBS schools, institutional support payments have nearly tripled in inflation adjusted terms since 2005, and overall subsidies (student fees plus institutional support) have more than doubled.
One might think that the corporate money pouring into college sports at least enabled athletic departments to run with financial independence. One would be wrong. If we add institutional subsidies to fees directly assessed to students for the privilege of attending a university with a large athletic department, the subsidy reaches $2.24 billion or about 19% of overall revenues for FBS schools.
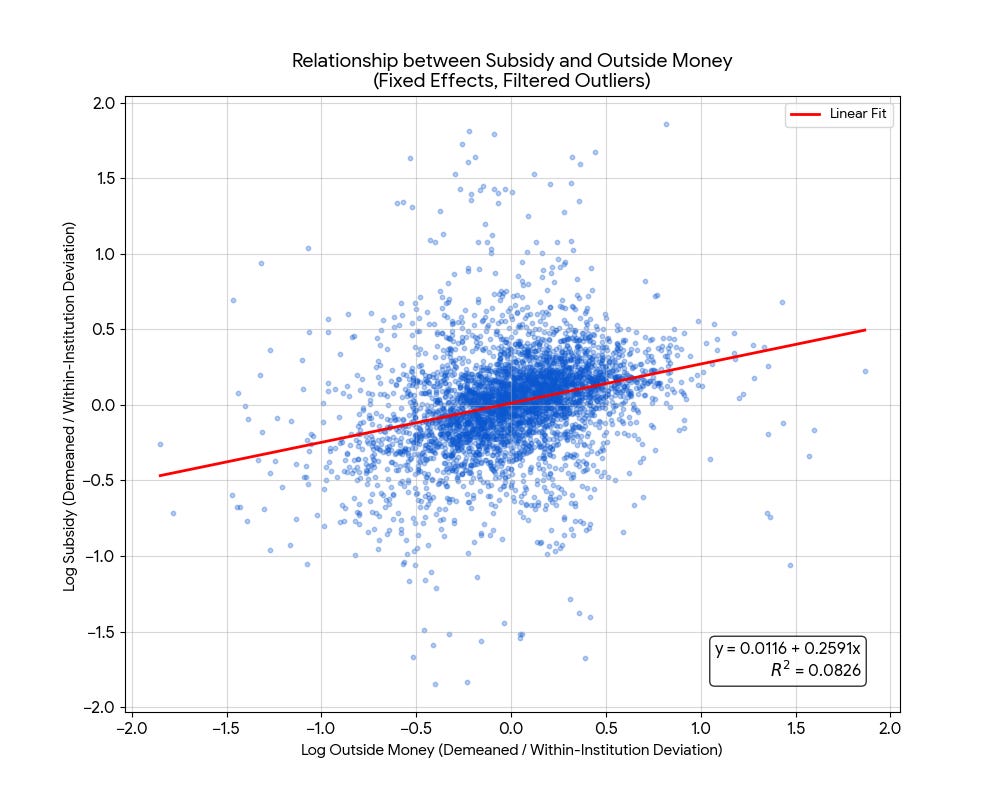
That’s the overall picture, but what about specific institutions? We looked at whether institutions that received the largest increases in outside money increased or decreased subsidies paid to athletics. To do this, we control for the average tendency of a specific institution to receive outside money or to subsidize, and look at whether changes in outside money correspond to changes in institutional subsidies.
Source: Authors calculations using Gemini code, based on USA Today data.
Each data point in that scatterplot is an institution-year. The overall relationship is positive; a 10% increase in outside money is associated with a 2.6% increase in university subsidies.
If we look at the FCS schools, they have also enjoyed large increases in corporate dollars (and flat ticket sales) and have also not weaned themselves from institutional subsidies. In fact, in these smaller schools subsidies account for nearly 70% of overall revenues. And yet, salaries and severance paid to football coaches continue to skyrocket. (Even in the NFS schools without the excuse of football programs, institutional subsidies account for 77% of athletic department revenue.)
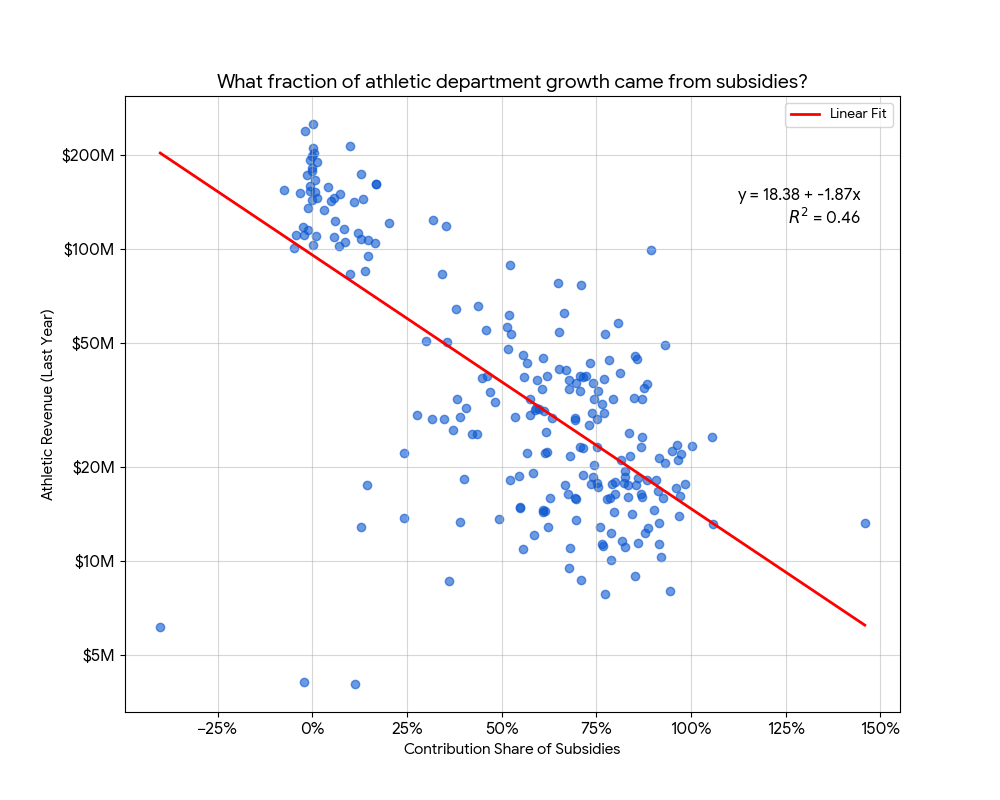
We can perform a similar calculation for institutional subsidies that we did for outside money: how much do these subsidies contribute to the overall growth of athletics revenues?
Source: Authors calculations using Gemini code, based on USA Today data.
Here we see a pattern that is inverse of outside money. For the largest athletic departments, subsidies typically contribute less than 25% of overall growth. But subsidies contribute the large majority — often over 75% — of overall growth in athletics budgets for smaller institutions.
A small number of universities (precisely 10 in 2023, including Purdue – good job guys!) actually run surpluses in their athletic programs. Others provide subsidies exceeding 90% of the athletics budget. The systematic pattern is this: the smaller the athletic department, the larger the share of institutional subsidies in a given year, and the more important subsidies are in allowing athletic departments to grow.
How Much do Subsidies Impact a Typical Student?
It can be helpful to express the extent of these subsidies to the athletic department in per capita terms, measured either relative to athletes or the total student body. The per athlete subsidy for Division I athletes averages $21,500, with similar totals for different subdivisions. Someone has to pay for these subsidies. We combined USA Today data with IPEDS enrollment data to show how large the subsidies are per undergraduate enrolled, and the distribution across public institutions.
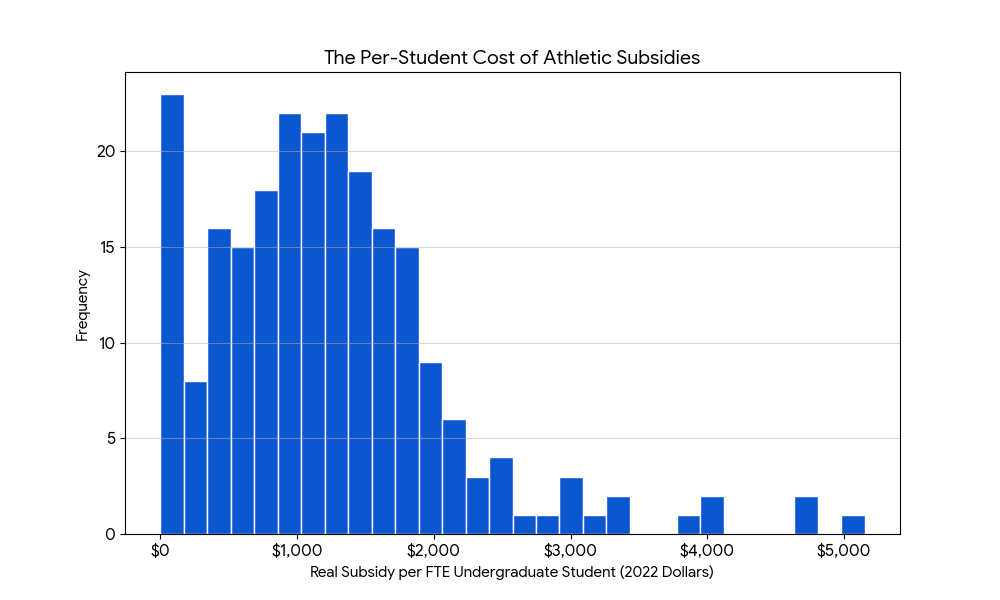
Source: author calculations using Gemini, based on IPEDS, USA Today data
In order to subsidize athletics, the median institution charges the rest of the student body (in direct fees, or indirectly via raising the cost of university operations) around $1100, or 6% the net price of attendance for the average public university. As the next graph shows, these subsidies have grown larger in real terms over the past 15 years for the large majority of institutions. We think this is an underexplored element of the rising cost of college attendance.
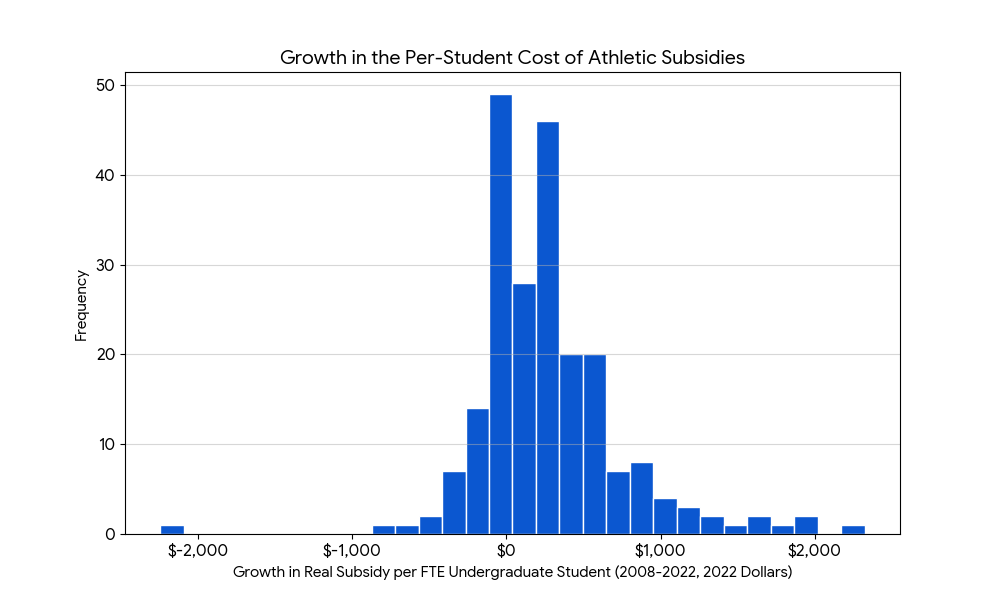
Source: author calculations using Gemini, based on IPEDS, USA Today data
At the Risk of Stating the Obvious…
Athletic competition is zero sum and this is pure arms race behavior. Across a broad range of expenses (other than spending on the student-athletes themselves) expenditures are rising as fast as the new revenue sources. Facility costs are skyrocketing as universities build luxe stadiums (and luxe locker rooms). Personnel budgets explode as schools engage in bidding wars over coaches, with whom they quickly grow discouraged and then pay large sums to be rid of.
And yet, the aggregate number of wins and losses has not changed. Nor has the number of championships won.
This is very different from a case where a lot of universities spend more money on cancer research. Only one university can have the #1 ranked cancer research center, but the primary output of cancer centers is the research itself, not the ranking. The more everyone spends, the more our understanding of the disease accumulates. In that case, spending and breakthroughs in one university facilitate breakthroughs at other universities in a collective effort to cure the disease.
But athletics is zero sum, and so pressure to win (from alumni, or boards, or politicians, or maybe even students) translates to: when outside revenue goes up, we are going to spend more. And, we are going to spend more even if outside revenue doesn’t go up. It would be one thing if the arms race were driven solely by ticket sales, corporate and donor dollars – those folks are getting what they paid for. It’s another thing entirely when the arms race is funded by drawing growing subsidies from students and the rest of the university.
Further, because universities could not, until very recently, share growing revenues with athletes they focused their spending on athletic department facilities and on staff and on coaches.
It’s not just the eye-popping 8-figure salaries paid to some head coaches. Last year 167 head basketball and football coaches in public universities made more than $1 million a year. (The median salary for the President of a public four-year university was less than half that.) While the number of teams in Division I have not grown, the number of assistant coaches has grown 62%. Some assistant football coaches’ salaries now top $3 million a year and even strength and position coaches make $1 million or more a year.
When the guy in charge of bench presses makes more than the university president, 10 times an average faculty salary, and absorbs the average cost of attendance for 60 students, it might be time to pause and reflect a little on where this is all going.
In our next two posts we will address two questions. One, do universities get any benefit from the massive subsidies they pour into athletics? And two, how will the new rules over NIL, revenue sharing, and the transfer portal change all this?
This post greatly benefited from research assistance and data work provided by Nayfa Johan.
“Finding Equilibrium” is coauthored by Jay Akridge, Professor of Agricultural Economics, Trustee Chair in Teaching and Learning Excellence, and Provost Emeritus at Purdue University and David Hummels, Distinguished Professor of Economics and Dean Emeritus at the Daniels School of Business at Purdue.
Great analysis. We look forward to having Dr. Hummels on our GoldandBlack.com Saturday Simulcast March 7, after all three parts have been published. I have some reading and thinking to do.
Kudos for tackling a third rail topic with thorough research. Looking forward to parts 2 & 3.