
How are Universities Funded?
Where Does the Money Come From, Where Does it Go, and What are the Current Risks?


As you are likely aware, abrupt changes in federal and state government policy toward universities have created significant uncertainty. In this explainer we provide some basic data to ground the reader in the overall funding environment for higher education. We focus our analysis on public and private not-for-profit degree granting institutions, leaving aside for-profit and non-degree institutions.
We ask three basic questions:
What has happened with expenditures and revenues for universities, both in the aggregate and on a per-student basis?
How have the sources of financial support changed over the past decades, including federal and state/local support, tuition revenue, and other sources?
How large are recent (proposed) federal cuts, relative to universities’ overall budgets, and relative to alternative sources of funds including foundation grants and industry research?
Aggregate Revenue and Expenditures
We begin by plotting aggregate revenue and expenditures from IPEDS, data in constant 2023 dollars.
Revenues for public universities grew 1.5% per year over 20 years. Revenues for private universities grew more slowly, 0.9% per year, and exhibited greater fluctuations in response to large swings in investment income gains and losses. (The S&P 500 stock index lost more than half of its value between October 2007 and February 2009. Then after a sharp pandemic dip in Spring 2020, that index gained 85% by the end of 2021. Your retirement accounts may remember some of that...)
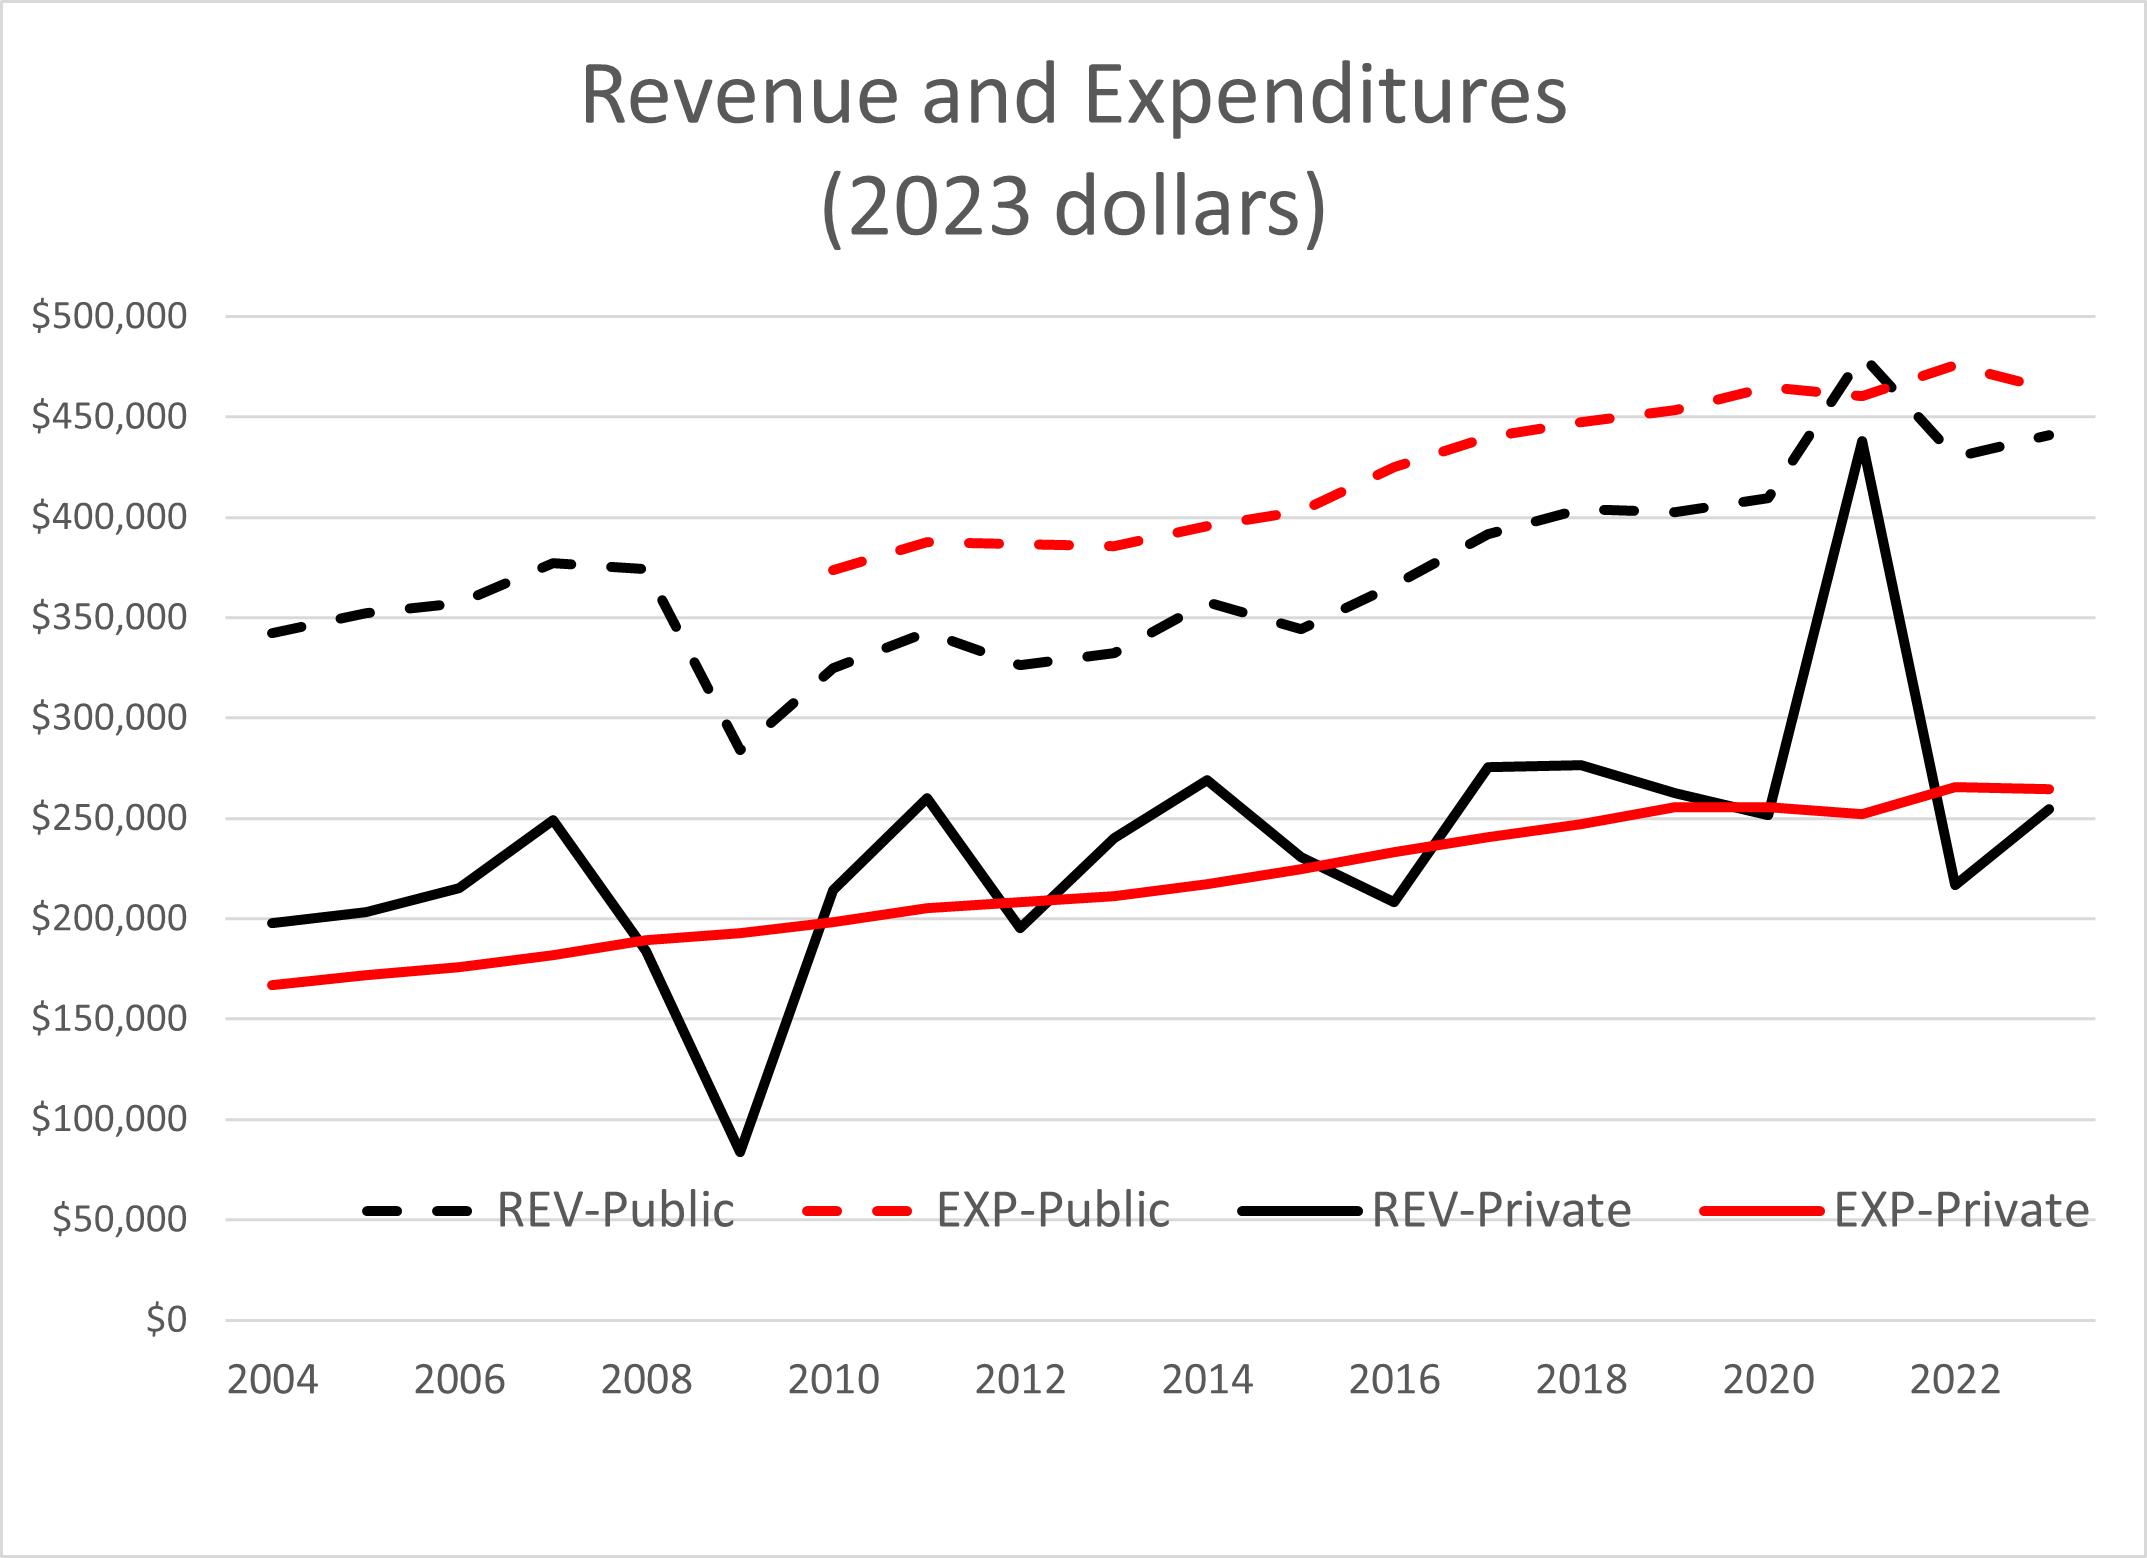
Source: Author construction from IPEDS data.
Expenditures (the red lines in the graph above) have grown more smoothly over time and are up about 1.5% per year for both public and private universities. (The time series for publics is shorter because of a switch in expense accounting standards that makes comparisons with earlier data difficult.) Notably, expenditures for public universities exceeded revenues for all but one year since 2010; deficits averaged 12% of revenue over this period. (This surprised us…we’re trusting the IPEDS data on this but it’s a little unclear to us how, in the aggregate, public universities can run large persistent deficits.)
Some of the growth in revenue and expenditures simply reflects an increase in student enrollment. The next chart examines university expenditures per FTE student broken into doctoral and non-doctoral institutions (where the highest degree is an MA/MS or BA/BS).
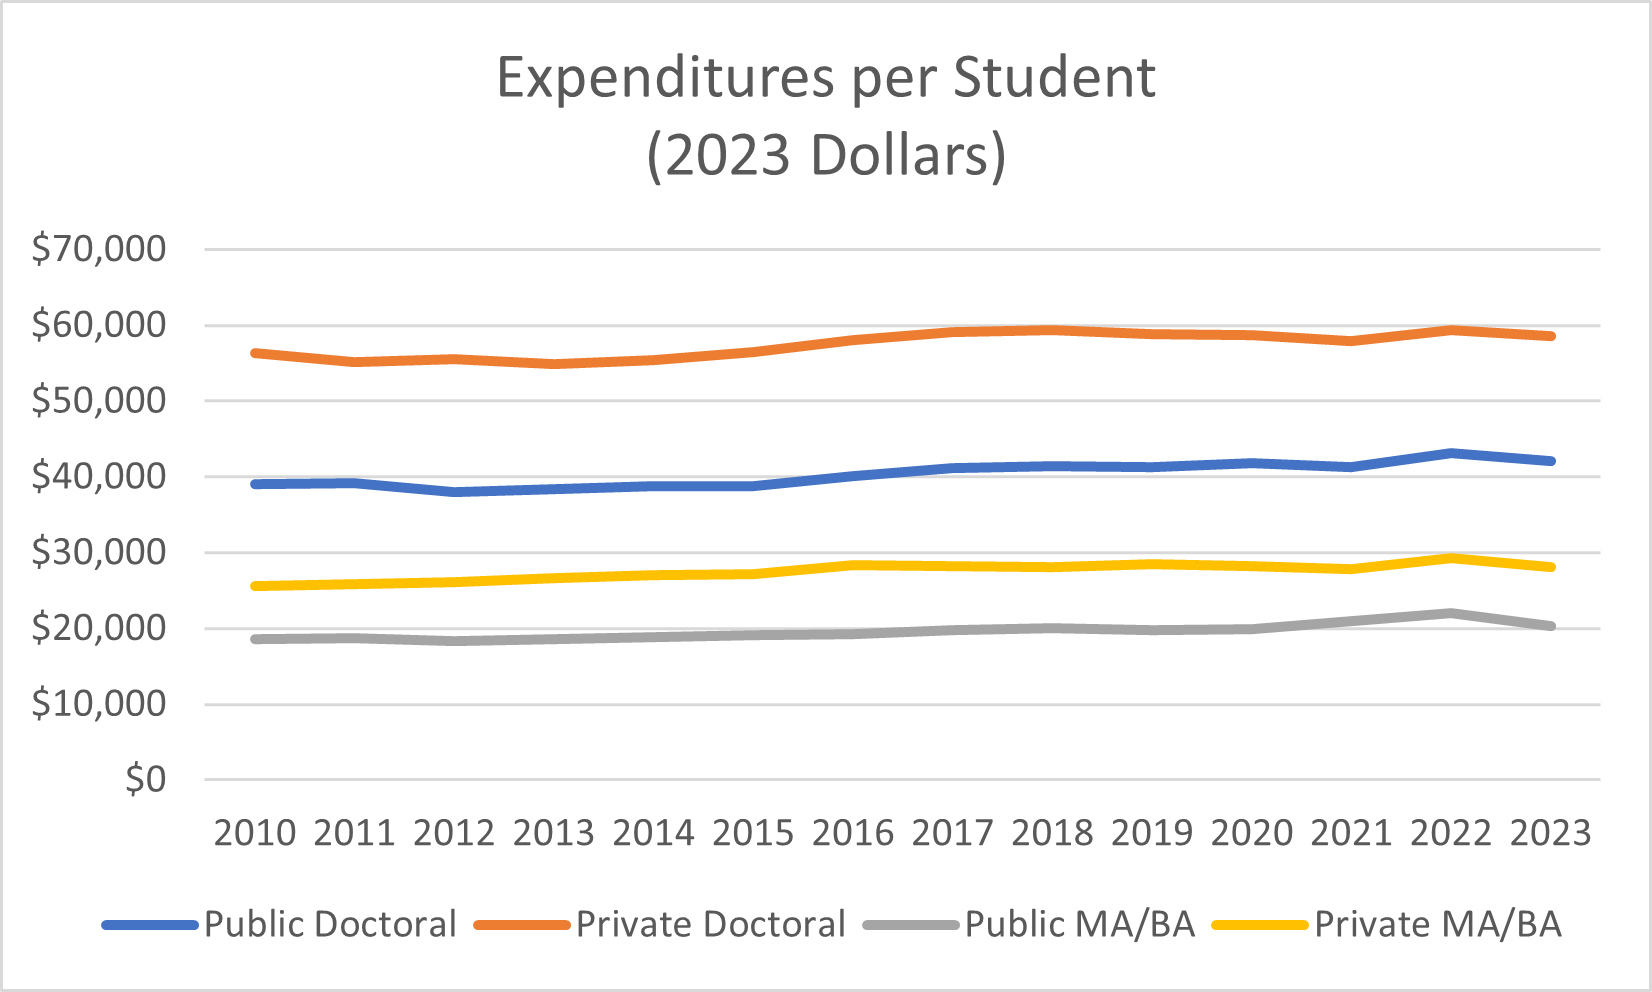
Source: Author construction from IPEDS data.
Two things are notable. One, this series is more stable and slower growing, around 0.7% growth per year for MA/BA institutions and less than half a percent a year for doctoral institutions. In other words, even while revenues fluctuate considerably, expenditures remain relatively stable year to year, and have grown very little on a per student basis over the past 15 years. Two, levels of expenditure per student are dramatically different in these institutions, with $/Student FTE in private doctoral universities nearly 3X the figure for public MA/BA institutions.
Of course, an important reason for this difference is that these institutions simply do different things and as a result incur different expenditures. Below we show a breakdown of expenditures for these institutions in 2023, which reflects these differences in mission. Note that the universities themselves report expenditures for each category, which means they have to make some assumptions about how certain expenses, e.g. faculty salaries, are split between activities like instruction, research, public service, etc.

Source: IPEDS.
The level ($/Student FTE) of instructional expenditures and academic support are higher for doctoral institutions, presumably reflecting a combination of higher faculty salaries, and smaller class sizes for graduate education. But instruction represents a similar overall share of expenditures across institutional types.
The larger difference lies in the composition of other types of spending. Research comprises close to 20% of spending at doctoral universities and these institutions also exhibit a much higher fraction of spending on other non-educational expenses such as athletics. To take a simple example, public universities in the Big10 spend an average of $157m per year on their Athletics Departments, an amount greater than TOTAL expenditures at 80% of public and private four-year universities in the US.
Public service represents a significantly higher spending category for public doctoral universities relative to the other types of universities, presumably related to the core mission of land-grant universities and the focus of other publics on engagement. Finally, student services and institutional support are a very large share of spending in private MA/BA institutions. This may reflect a combination of mission and scale – some of these functions are fixed costs, and larger enrollments lower the per student cost of the services.
Who or What Pays the Bills?
What about the source of funds? The table below provides the percentage distribution of funds in 2023 (the distribution is broadly similar in earlier years, with some exceptions noted below), again broken into public and private not-for-profit universities, and within these groupings into doctoral and MA/BA institutions. Some noteworthy data points are presented here.
Private institutions, especially MA/BA institutions, are highly dependent on tuition revenue, and less dependent on government sources.
Public institutions are much more dependent on government funds. Public MA/BA institutions receive almost 2/3 of their funds from government sources.
Gift and investment income is a much greater share of revenue for private institutions in a typical year, but this is a two-edged sword due to fluctuations in investment returns.
Hospital revenues comprise 19% of revenue for public doctoral institutions and almost 18% of revenue for private doctoral institutions. This revenue source is highly skewed as only 90 out of 2424 four-year institutions report hospital revenue (i.e., have a hospital) and yet hospital revenue in this small number of institutions is large enough to generate almost one out of every five dollars.
Auxiliary services generally include food and housing, and in some universities, athletics. (Some universities report athletics in “other”). These fund sources took an especially large hit during COVID, dropping 35%, as university dorms and dining halls emptied out and athletics were cancelled or played in empty arenas.

What does this tell us about vulnerabilities?
There has been a great deal of focus on federal funding cuts to the sciences, which primarily hit doctoral institutions. We’ll address this in more detail in our next post, but first, let’s focus on some other vulnerabilities: demographics, health care cuts, investment income, and state/local/federal budgets.
Demographically, this academic year represents the high-water mark for the number of 18- to 21-year-olds in the population, after which numbers start to drop (the so-called “enrollment cliff”). Worse, the proportion of high school grads attending college is declining. These enrollment declines will hit private MA/BA institutions especially hard given the importance of tuition revenue AND the importance of auxiliary services such as housing and food to their total revenue. They can buy less food, but they’re stuck with paying the capital costs of the residence and dining hall capacity they committed to in years past.
Cuts to hospital reimbursement rates and increases in the number of medically indigent patients, due to federal Medicaid cuts, are likely to represent a major hit to hospital revenues. There are 35 private universities with a hospital; for them the hospital generates an average of 31% of total revenues. There are 55 public universities with a hospital, and for them the hospital generates an average of 41% of total revenues. Barring changes in laws requiring hospitals to offer care to the medically indigent, or states expanding their Medicaid expenditures to back-fill the federal cuts, these hospital-laden universities are likely to experience big losses.
As of this writing, the stock market is riding high. But earlier this year, the shock of “Liberation Day” tariffs caused a 20% decline in asset prices before much of that policy was delayed and investors settled down. And, there is increasing noise about the extent to which these aggregate equity valuations are driven by a small number of tech stocks, particularly those connected with new AI technologies. If this represents another round of “irrational exuberance” that hits investment income, private institutions are in for more pain. In 2009, private institutions generated $85billion in aggregate revenue, and took $84billion in investment income losses…
Government Funding and Universities’ Vulnerability
We noted above that these funding sources – with the exception of investment income – do not vary much year by year. But if one looks at a longer time span we can see large changes in some series. For example, let’s look at government funding as a % of total revenue in public universities, separated into federal and state/local funding. We are aggregating over three categories: grants and contracts (funding for specific deliverables); appropriations; and non-operating appropriations.
The chart below includes some sample changes because of the way data were reported in earlier years. For 1980-2000, the data series captures all public universities; from 2003-2008 it is all public four-year universities (i.e., excluding two-year and non-degree publics); from 2009-2023 it separates four-year publics into doctoral and MA/BA institutions.
State/local support of public universities once exceeded 50% of their total revenue, then dropped sharply after the 2000 recession. This drop, and the flat appropriations over the next decade, combined with rapidly rising enrollments, meant that state/local support per student FTE fell dramatically: almost 40% between 2000 and 2012.
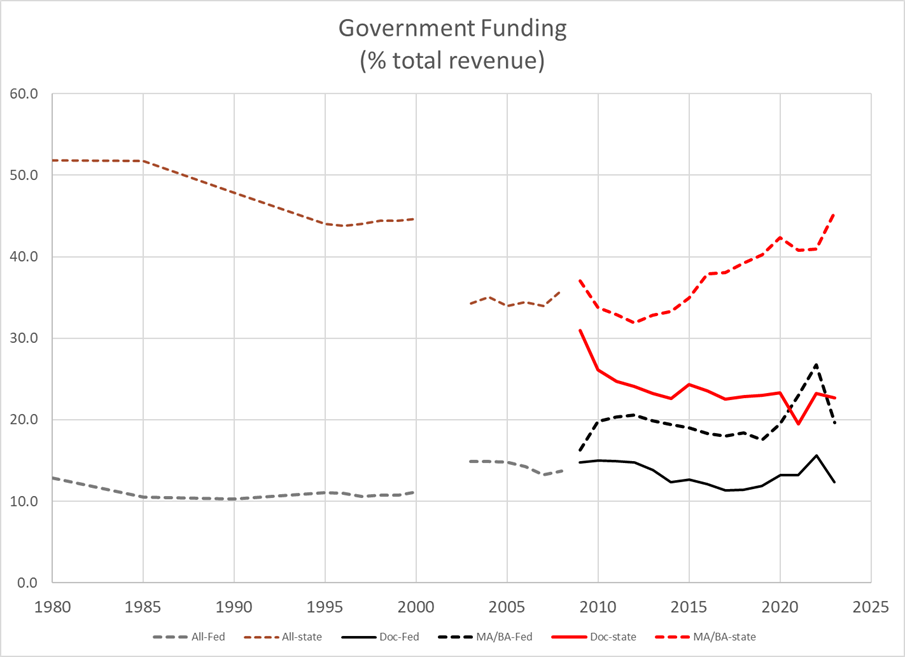
After 2009 we can see an increasing divergence between doctoral and MA/BA institutions. The share of state funding for doctoral institutions dropped from 31% to 22%, while this share for MA/BA institutions’ rose from 32% to 45%. Non-doctoral institutions have become extremely reliant on state/local funding and are at particular risk should state budgets become less generous.
To our surprise, MA/BA institutions are increasingly dependent on federal sources of funds as well, with federal nonoperating grants and federal appropriations comprising the bulk of these funds. In contrast, doctoral institutions primarily receive federal grants and contracts, at a steady share of their revenue.
There are several sources of vulnerability here.
First, some federal programs provide targeted support for non-doctoral institutions because they serve a unique mission. For example, the Trump administration has proposed $350 million in cuts to Hispanic-Serving Institutions under the broader purge of DEI-related activities in higher education.
Second, during and after the pandemic, the federal government pumped funds through states into universities for two reasons. One, to insulate universities from the economic shock. Two, because, unlike many slow-to-build infrastructure investments, universities are “shovel-ready”… they don’t need a decade to start spending money and circulating it through the economy.
Data from the Grapevine Report, provided by SHEF (State Higher Education Finance) shows that the aggregate federal stimulus numbers totaled $13.6bn from FY 2020-2025, and peaked at 3.3% of states’ total higher education expenditures in FY2023. These numbers were much higher for some states, e.g. 20% of Connecticut’s and Vermont’s expenditures on higher education in 2023 came from stimulus funds. As the stimulus funds receded, state support rose to take its place - but this may look to legislators like a case of “higher education already got theirs…”
Third, state budgets depend on federal budgets more broadly. The Bureau of the Census provides detailed information on state and local government budgets including the source of these funds. Nation-wide, 35% of state budget revenues originated in transfers of federal funds. This number is considerably higher in some states, exceeding 45% for Alaska, Arizona, Louisiana, Missouri, and Wyoming. Even a modest pullback of federal funds, particularly funds related to health care expenditures, represents a huge hit to state budgets.
Fourth, the Census data shows that higher education represents a significant expenditure category on state budgets. This is a little tricky to interpret because the Census data report state expenditures on higher ed as including both the state appropriation and tuition paid, and also mingle together monies coming from the state and from federal sources. Sparing you the details… nation-wide higher ed is about 10% of state budgets counting only funds that don’t come from the federal government
The broader point is… when state legislators start looking for cuts, higher education is going to be a juicy target. And that will be particularly true in cases where higher ed spending is a larger share of the overall budget.
What, us worry?
Let’s do some quick back of the envelope calculations to think about the potential magnitude of some economic shocks on universities’ top line revenue. As a starting point, we can use the fund source table and multiply percentages together to think about the impact on different kinds of universities.
Estimates of the demographic cliff suggests that the number of 18-year-olds will fall by 13% by the year 2038. If we hold the college going rate and tuition (in real terms) steady, and enrollment were to fall uniformly across all institutions, this would represent a 2.2% revenue cut for public institutions and a 5.8% cut for private MA/BA institutions. (To get this 2.2%, multiply 13% by the tuition share of revenue of 16.8% for publics and 44.3% tuition share of revenue for private MA/BA institutions.)
Earlier this year, equity prices fell 20% in response to the Liberation Day tariffs before rebounding. A 20% decline in investment income would reduce revenues for public MA/BA institutions by 1.4% and in private MA/BA institutions reduce revenue by 6%.
The largest federal spending cut currently pending would eliminate roughly $150bn a year from programs administered by states, including Medicaid and SNAP (Supplemental Nutritional Assistance Program, aka food stamps). This leaves state legislators a choice between replacing that funding or seeing a rising number of uninsured and food insecure households and having a calamitous effect on, e.g. rural hospitals.
Where will they find these funds? First, they can’t make use of federal transfer funds for this, since these are specifically earmarked and are in any case being cut. So that eliminates 35% of the budget for the average state. Second, it doesn’t make sense to cut their own spending on Medicaid to replace federal cuts in Medicaid. That’s another 19% of their budget. We’re starting to run out of pockets to look in…
Suppose states were to enact a 20% across-the board cut in funding for every other thing they do, including university funding, to pick up the slack with Medicaid. This cut would hit MA/BA institutions twice as hard (a 9% cut) as doctoral institutions (4.5% cut) because state and local funding is twice as important in their overall budget.
Wait, we forgot something…
Oh, right. The proposed federal cuts to science. We’ll tackle that, and whether alternative fund sources might save the day, next week. Thanks for reading Finding Equilibrium!
“Finding Equilibrium” is coauthored by Jay Akridge, Professor of Agricultural Economics, Trustee Chair in Teaching and Learning Excellence, and Provost Emeritus at Purdue University and David Hummels, Distinguished Professor of Economics and Dean Emeritus at the Daniels School of Business at Purdue. Research assistance on this post was provided by Yixuan Liu.
The general picture does seem dismal. I would add that the shake-out is happening exactly today. To me the devil is in the detail - more specifically the devil is within your peer group. A regional school is not competing with other schools on the other side of the country; it is competing with its in-state neighbors maybe within a one hundred miles. If we're down 10-20% in revenues, it would seem maybe 1-2 out of ten won't make it, but I would think the vast majority will.
https://cliffwilliams.substack.com/p/defiance-and-delay-feds-stonewall?r=237mn9